
If you want to know whether your solar panels are working, start with the information your system already gives you. During daylight hours, check the inverter or monitoring app for current power, today’s generation and any visible alerts. Then compare recent performance with your own historical data under reasonably similar conditions.
These checks can show whether your system appears to be operating normally, whether something has changed, and whether there is enough evidence to justify further investigation. They cannot tell you the technical cause of a fault or certify that every component is working correctly.
Start here:
- Check the system status during daylight. Look at the inverter display, app or monitoring portal if your system has one. A zero power reading at night is normal and is not evidence of a fault.
- Check whether generation is being recorded. During daylight, look for a current power reading or today’s accumulated solar generation where that information is available.
- Review recent history. Compare recent days and weeks rather than judging the system from one moment.
- Put the result in context. Consider cloud, season, shading, temperature and any known grid or communications interruption.
- Look for a pattern. One low-output period may be normal. A persistent unexplained change, repeated alert or complete loss of generation deserves more attention.
- Record what you can see and escalate safely. Save screenshots, dates, alerts and relevant generation history before contacting your installer, retailer or another appropriate professional.
The Australian Government Solar Consumer Guide recommends monitoring solar generation and reviewing past system data to help understand whether a system is generating as expected.
Two common solar readings are power and energy.
Power is an instantaneous rate, usually shown in kilowatts (kW). It can rise and fall throughout the day as conditions change. Energy is the amount generated over time, usually shown in kilowatt-hours (kWh). A daily generation figure is therefore different from the power your system happens to be producing at one particular moment.
Your system’s rated capacity is not a promise that it will produce that number of kilowatts continuously. Solar generation changes with location, season, weather, panel direction and tilt, shading, equipment and configuration. Network export limits can restrict how much electricity a system sends to the grid and, in some cases, excess generation may be curtailed. Australian Government guidance explains that these limits are set by local distribution network service providers and can vary by network and connection arrangement.
There is no single daily figure that proves whether every Australian solar system is working correctly.
The safest homeowner method is usually to compare the system with itself: look at its own historical output under reasonably comparable conditions. Australian Government guidance notes that climate and sunshine vary by region and affect generation.
If you want the detailed design explanation, our article on how panel direction affects solar output covers orientation and tilt in more depth.
What is normal, and what may need investigating?
Australian solar output changes naturally. Bureau of Meteorology data show that average daily solar exposure varies by month, season and location, and is influenced by clouds and the position of the sun. BOM solar-exposure maps describe the solar energy reaching a horizontal surface; they are useful for understanding broad variability, not for diagnosing an individual rooftop system.
| What you notice | Could be normal when… | Worth investigating when… | Safe next step |
|---|---|---|---|
| Lower output today | Conditions are cloudier or otherwise different from comparable days | The reduction persists in broadly comparable conditions | Compare several recent days |
| Lower winter generation | Shorter days and seasonal solar exposure explain the change | The system behaves very differently from its own previous comparable periods without an obvious reason | Review historical data |
| Output rises and falls through the day | Sunlight and operating conditions are changing | The daily pattern changes repeatedly without an obvious explanation | Compare similar-day curves |
| Output suddenly drops | Temporary cloud or another short-term condition coincides with the change | It stays unexpectedly low or an alert appears | Record the time, status and history |
| Monitoring data is missing | Internet or communications were interrupted | Missing data persists or other evidence suggests generation has stopped | Check other safely available status information |
| Electricity bill is higher | Consumption, tariffs or billing period changed | Monitoring also shows an unexplained sustained generation change | Compare the same time periods |
| An inverter alert appears | It is brief and the system returns to normal | It persists or repeatedly returns | Record the exact message and seek support |
| A neighbour generates more | Their system size, shade, orientation or configuration differs | — | Use your own history as the primary benchmark |
Missing monitoring data is not the same as missing generation
A blank graph or gap in an app does not automatically mean the solar panels stopped producing electricity.
Monitoring platforms often depend on a communications link. The Australian Government notes that apps and portals can store historical operating data and that monitoring may rely on internet-connected system components.
This creates two different possibilities:
- Monitoring-data gap: the system may be generating, but data is not reaching or displaying in the portal.
- Possible generation problem: available system information indicates that solar production itself has stopped or changed unexpectedly.
Monitoring records are evidence of what was recorded. They do not, by themselves, establish the technical cause of a problem.
A Fronius example: using monitoring history
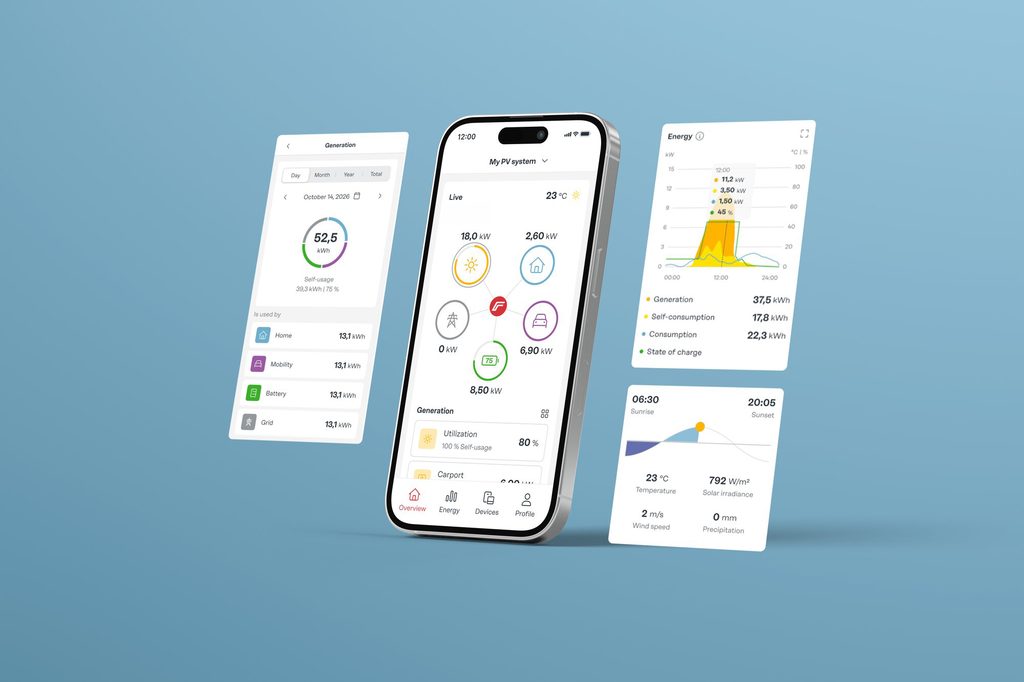
For compatible and correctly configured systems, we can display PV yield, current values, daily curves and historical energy information in Solar.web. To view generation data, your system requires a compatible inverter (like the GEN24 or Verto) with integrated data communication. To view household consumption data, your system also requires a Smart Meter. Generation data and household consumption data are different types of information, and the data available in Solar.web depends on the components installed and how the system is configured.
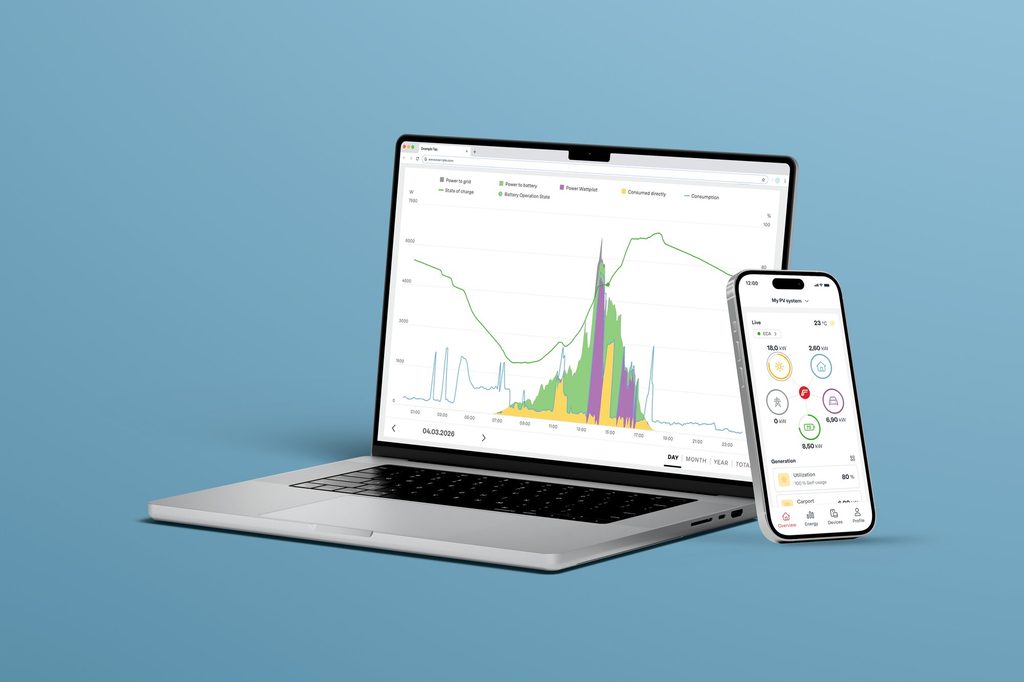
You can use Solar.web as part of the broader approach described in this article by comparing current values, daily curves and historical records to identify changes in system performance over time. However, Solar.web data alone cannot determine the technical cause of a fault. Have a qualified professional assess the system to identify the underlying issue.
For broader inverter information, see how the solar inverter affects and monitors system performance.
Use comparisons, not one-off numbers
The most useful homeowner comparison is usually a pattern over time.
First example: Imagine a system recorded 24 kWh on one clear day and 13 kWh on a cloudier day. The second figure is lower, but that does not prove the system is underperforming. The weather conditions were different, so the comparison is not like-for-like.
Now imagine the same homeowner notices that the system’s daily curve looks consistently different across several broadly comparable days. That repeated pattern is more useful evidence than one isolated reading.
Second example: A monitoring portal shows no data for part of an afternoon. That does not prove generation stopped. If later data, inverter status or other safely available information suggests the system continued operating, the gap may have been related to communications rather than solar production.
Seasonal comparison works the same way. Compare winter with previous winter periods where possible, rather than treating a summer day as the benchmark for June or July.
Even apparently similar days can differ because of cloud, temperature, temporary shading, network export limits where curtailment occurs, and other operating conditions. Export limiting is only one possible contextual factor and does not diagnose an individual system problem.*
*Illustrative examples only: not an expected production benchmark. The examples above demonstrate a comparison method, not a production target.
When should lower output be escalated?
Consider escalating when you see:
- a persistent or repeating inverter alert;
- no recorded generation during daylight when the system would ordinarily be expected to generate and the result is not explained by a monitoring-data gap;
- a sustained unexplained change from the system’s own historical pattern;
- repeated missing data that you cannot account for;
- a material change that persists under broadly comparable conditions; or
- visible damage, smoke, a burning smell, exposed wiring or unusual electrical behaviour.
Before contacting the appropriate installer, retailer or service professional, gather:
- the date and approximate time the issue began;
- the visible inverter or system status;
- the exact alert or error message where available;
- screenshots from the monitoring app or portal;
- today’s generation and recent history;
- comparable historical data where available;
- dates of any missing-data periods;
- relevant weather conditions;
- whether there was a known internet or grid interruption;
- recent bills if the concern started with billing;
- the system or inverter make and model from existing records; and
- a short chronology of what changed and when.
Use this decision path:
Is the system showing normal generation during daylight?
First, compare recent history and conditions to determine whether the change is unusual. If the pattern appears normal, continue monitoring. Where a persistent and unexplained change remains, document it and seek a professional assessment.
Is generation zero, unusually low or unclear?
Check whether there is a visible alert and whether monitoring data itself may be missing. Record what you can see without opening or manipulating equipment. If the issue persists, escalate.
Is there visible damage, smoke, a burning smell, exposed wiring or unusual electrical behaviour?
Do not approach or manipulate the affected equipment. Energy Safe Victoria warns that solar equipment can remain energised during daylight and advises people not to go near damaged equipment or cables. Seek appropriately qualified electrical assistance. This is Victorian safety guidance; electrical requirements and terminology can vary by jurisdiction.
Do not use a multimeter for these homeowner checks
You do not need to measure solar-panel voltage or current with a multimeter to carry out the checks in this guide.
Do not open an inverter, switchboard or isolator, disconnect cables or connectors, climb onto the roof or perform electrical fault-finding. Energy Safe Victoria advises people not to attempt electrical repairs themselves and warns them to stay away from damaged solar equipment and cables.
The homeowner’s role is to observe, compare, document and escalate, not electrically diagnose the system.
How much power should my solar panels produce?
There is no single instantaneous power reading that proves every Australian solar system is operating correctly. Power, measured in kilowatts (kW), changes throughout the day, and a system’s rated capacity is not its constant output. Daily generation is energy, measured in kilowatt-hours (kWh), and also varies according to location, system size, season, weather, orientation, tilt, shading, equipment and configuration. Compare your system with its own historical results under reasonably similar conditions rather than relying on one universal kW or kWh figure.
Is zero solar output at night normal?
Yes. Solar panels need sunlight to generate electricity, so a zero current-power reading at night is normal.
Does a higher electricity bill mean my solar system is faulty?
Not necessarily. Bills can change because of consumption, tariffs, billing periods and other factors. Compare the billing period with your solar-monitoring history before assuming a generation problem.
Can cloudy weather make solar output drop significantly?
Yes. Clouds change the amount of solar energy reaching the panels. BOM data show that solar exposure varies with cloud and other atmospheric conditions.
Does missing Solar.web data mean my Fronius inverter stopped generating?
Not necessarily. A monitoring-data gap can be different from a generation problem. Solar.web relies on compatible equipment, correct configuration and reliable communications. For that reason, missing data in Solar.web does not necessarily mean your system has stopped generating power.
When should I call an installer or professional?
Escalate when an unexplained change persists, an alert repeatedly returns, generation appears to stop during daylight without a clear monitoring explanation, or there is any safety concern. Do not perform electrical testing yourself.
The safest way to check whether your solar panels appear to be working is to combine status, context, pattern, evidence and escalation.
Look at the information already available during daylight, compare the system with its own history, allow for normal weather and seasonal variation, and distinguish a monitoring-data gap from a generation problem. If the change persists or there is a warning or safety concern, record the evidence and seek appropriate professional help.
That approach gives you useful information without turning a homeowner check into electrical fault-finding.