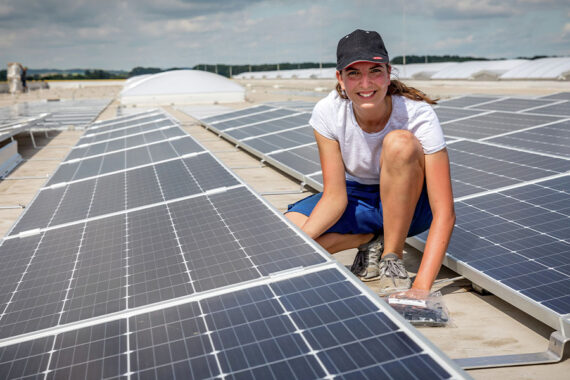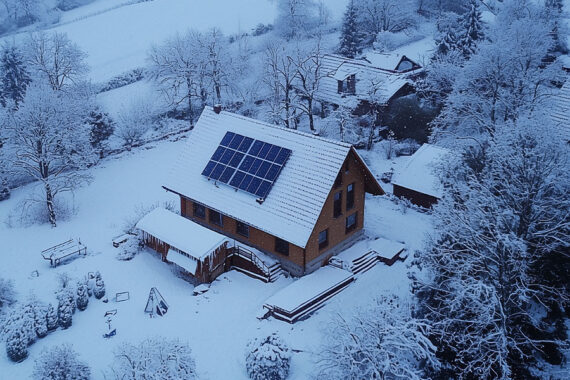
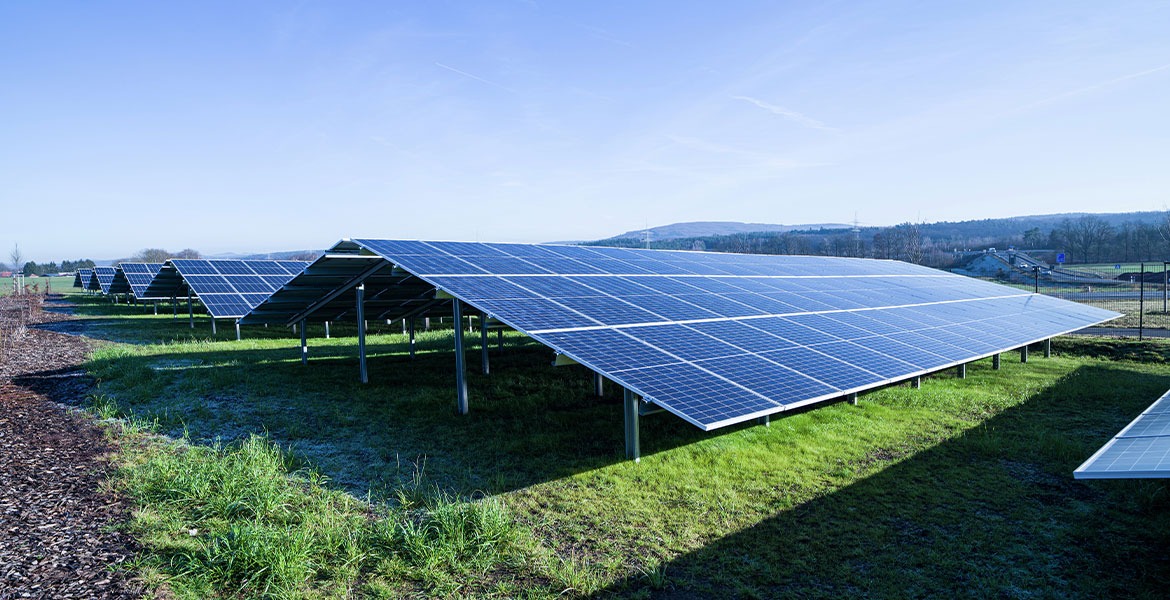
There have always been many myths surrounding solar energy. A common misconception is that photovoltaics (PV) are too expensive an investment and ineffective during winter months. (read more about this here). Others claim that the manufacturing of PV components generates more CO2 than they can save during operation. So, is solar energy actually good for the environment? We’re getting to the bottom of this question by analyzing the environmental impact of photovoltaic systems.
At first glance, the answer to the question of whether using solar panels reduces the carbon footprint seems simple: sunlight + solar modules = electricity. In fact, no CO2 is emitted during direct use. That is true, in principle. But only at first glance.
After all, the photovoltaic modules (commonly known as solar panels) inverter, and optional energy storage device must be installed on the property and put into operation. Before installation can begin, the equipment must first be delivered using an appropriate means of transport. Before any of this, the raw materials required for production must be extracted, processed, and manufactured into the components that make up a photovoltaic (PV) system. One point that is far too often overlooked is recycling: What happens to photovoltaic components at the end of their service life? The environmental impact differs depending on whether the components are landfilled, incinerated, or partially recycled.
So as you can see, the solar energy value chain encompasses several industrial and service sectors:
- Raw material extraction
- Manufacturing of individual components
- Transport
- Installation and maintenance work
- • Waste management and recycling
To determine whether photovoltaic (PV) systems can reduce greenhouse gas emissions, we need to take a closer look at the life cycle of a PV system—from sourcing to the end of service life. We have based our analysis on studies conducted by the International Energy Agency (IEA) and the Fraunhofer Institute for Solar Energy Systems (ISE). The latter certified the life cycle assessment of the Fronius Symo GEN24 10.0 Plus carried out by Fronius in cooperation with to4to – together for tomorrow. It should therefore be noted at the outset that the data focuses on PV modules in general and on Fronius inverters in particular. We do not take into account the life cycles and CO2 emissions of other inverter manufacturers.
Incidentally, strictly speaking, we should be referring to CO2 equivalents throughout, because several different greenhouse gases are relevant to the potential emission of greenhouse gases. For the sake of simplicity, we will usually be referring to CO2 emissions in this blog.
1. Solar panel raw material extraction and components
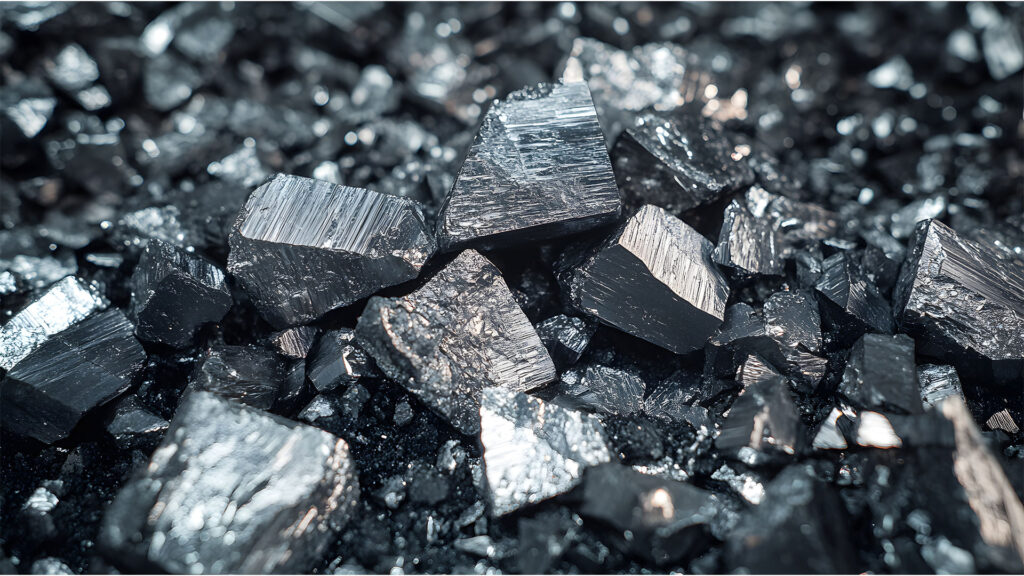
The production of solar panels, and inverters depends on the extraction and processing of certain rare raw materials. Quartz sand is one of the most important raw materials, as the silicon extracted from it is essential for modules and semiconductor components. The process requires high temperatures of 1500 to 2000 °C, which makes it the most energy-intensive phase in the production of solar panel components. The energy mix used plays a key role.
| Did you know? Nine of the ten largest polysilicon manufacturers are based in China. Together, they have a market share of 93.5%. China’s electricity mix is based on average on 61% coal energy. This has a large carbon footprint. The production of solar panels in China emits an average of 810 kg of greenhouse gases per kilowatt peak of module output. Up to 50% of emissions are attributable to silicon production. To put this in perspective, comparable modules manufactured in Germany emit approximately 580 kg of CO2 per kWp of module output.* *Source: https://www.ise.fraunhofer.de/en/press-media/press-releases/2021/european-glass-glass-photovoltaic-modules-are-particularly-climate-friendly.html |
It is easy to underestimate the importance of glass in solar panel production. The dominant portion of the weight, at approximately 70%, is accounted for by materials produced from sand. Although its production is less energy-intensive than silicon processing, its mass makes glass relevant to the overall energy balance. For thin-film modules, the aluminum frame is also a factor, accounting for between 10 and 15% of a solar module’s total carbon footprint. This is because aluminum production also requires large amounts of electricity.
Other materials essential to the solar industry include copper, tin, silver, gold, and palladium. The latter precious metals in particular are considered critical raw materials. This brings us to the next essential PV component: the inverter.
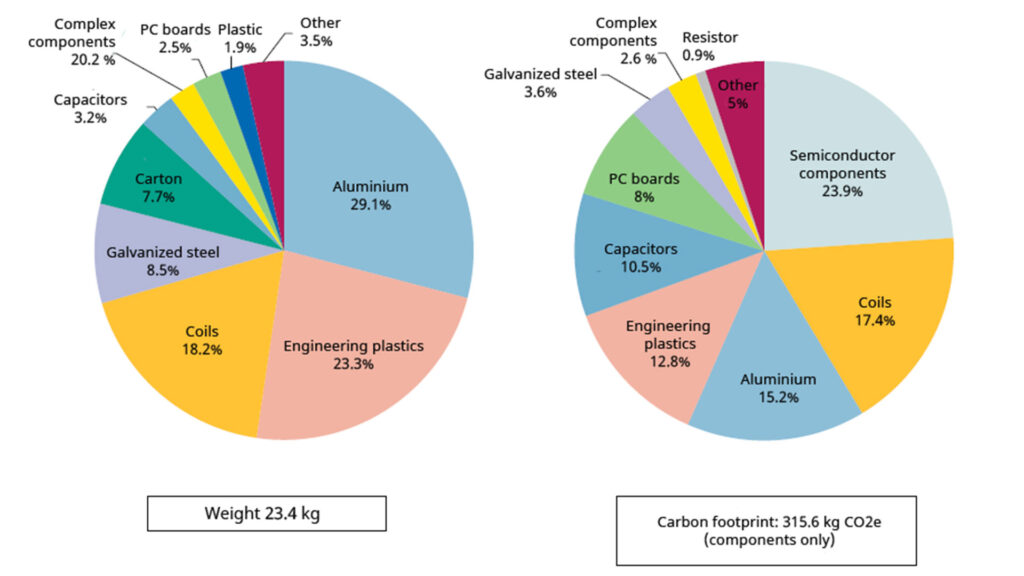
As an inverter manufacturer, we have the advantage of first-hand information: more than 40% of the total carbon footprint of the Fronius Symo GEN24 10.0 Plus is attributable to its components when the inverter is used in an Austrian photovoltaic system. What is striking is that although semiconductor components account for only a marginal .01% of the inverter’s weight, they are responsible for 23.9% of its carbon footprint at the component level. Capacitors and PC boards also count among the energy-intensive components of a Fronius inverter. Although they account for only 3.2% and 2.5% of the total weight, they are responsible for 18.5% of the total 315.6 kilograms of CO2 emitted by the components. The situation is quite the opposite when it comes to the required plastic and aluminum. As Fronius uses recycled aluminum, it has a lower environmental impact despite its high weight proportion of 29.1%. About 15.2% of the component’s carbon footprint is attributable to the light metal.
2. CO2 emissions due to solar panel manufacturing
For solar cell production, the purified silicon must be cut into thin slices, known as “wafers”, and cleaned. This process requires a great deal of energy and accounts for 15 to 20% of total emissions. The subsequent cell production process, in which the wafers are roughened, doped, and laminated, accounts for an additional 10 to 15% of CO2 emissions. During doping, chemical impurities are selectively introduced into the silicon to create a positively and a negatively charged region, thereby enabling the current flow.
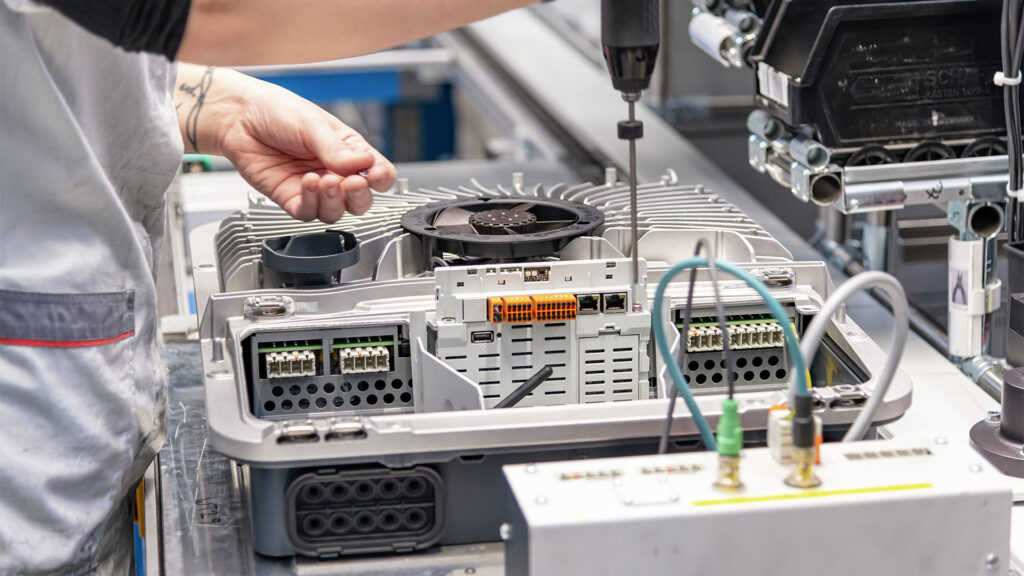
In contrast, the manufacturing of a Fronius inverter accounts for only a small portion of its CO2 emissions. Beyond recycled aluminum, the energy mix, drawing on rooftop solar power from the company’s own production facility and green grid electricity, plays a key role in cutting production-related greenhouse gas emissions. Only 1.3% of the total output is attributable to the energy used in the manufacturing process.
3. How does the transport impact the carbon footprint of solar energy?
The transport of raw materials to the component manufacturer, the delivery of components to the system site, and subsequently to the recycling facility have only a minor impact on the environmental footprint of a PV system. Nevertheless, we don’t want to ignore it entirely. Naturally, the longer the transport route, the more energy required. Components imported from Asia to Europe have a larger carbon footprint.
It is not only the distance that matters; the mode of transportation also plays a crucial role. While cargo planes can quickly transport PV components to their destination, they also generate the highest greenhouse gas emissions per component transported. Traveling by sea is more efficient, but takes longer. For example, the journey from Shanghai to Western Europe by container ship takes just under a month. Truck and rail transport have a moderate ecological footprint.
How does transportation affect the carbon footprint of solar panels? Around 3% of the total carbon footprint of solar modules from China is attributable to imports to Europe. That doesn’t sound very dramatic. Nevertheless, solar panels manufactured in Europe are on average significantly more environmentally friendly. Compared to their Asian counterparts, they reduce CO2 emissions by approximately 40% thanks to a lower-emission energy mix in production and shorter transport routes, as calculated by the Fraunhofer Institute in a 2021 press release.
Where inverters are concerned, supply routes account for an even smaller share of emissions—especially if we again take Fronius as an example. “By avoiding air freight and relying instead on trains, trucks, and container ships, we reduce CO2 emissions. The supply of raw materials and delivery to customers in Austria account for just 1.1% of total emissions from Fronius inverters,” says Anthony Moises, solar expert at Fronius International. When the inverter is exported, the proportion naturally increases slightly.
4. Environmental impact of installation, maintenance, and operation of PV systems
The installation and maintenance of solar panel components also account for only a small single-digit percentage of a PV system’s total carbon footprint. The use of machinery and tools, some of which are powered by electricity and others by fossil fuels, results in only negligible greenhouse gas emissions.
What’s much more interesting, however, is operation. Everyone knows that the sun doesn’t shine at night. Photovoltaic systems—especially those without a battery connection—are therefore ‘idle’ 50% of the time and do not generate any electricity. “But the inverter never sleeps,” explains Anthony Moises. “Firstly, it checks at regular intervals to ensure that the public grid is stable. Secondly, it always remains ready for operation in order to recognize the next sunrise and direct energy flows. Communication with Smart Meters, battery storage, and monitoring apps also requires a small amount of power consumption.” In total, this night consumption amounts to 2 to 10 watts (without a battery) or 20 to 200 watts (with a battery connection). Not much, really. However, because inverters remain in operation for years, the carbon footprint of nighttime electricity demand adds up over time. This is especially true when the power is drawn from the public grid rather than from the dedicated battery storage.
In the case of the Fronius GEN24 10.0 Plus, night consumption accounts for 37.6% (AT) and 47.2% (DE) of its total carbon footprint. The exact percentage depends heavily on the country’s typical electricity mix and may be even higher in other countries. For example, night consumption in Australia accounts for more than 63% of the inverter’s total carbon footprint.
Even though the Fronius inverter has an efficiency rating of over 98%, losses in the form of heat occur during operation. These account for 22.5% (AT) and 19.6% (DE) of the carbon footprint respectively.
5. Recycling of solar panels
A PV system lasts for several decades. But eventually, even the best components reach their limit. Fortunately, most solar panel components can be recycled. There are various strategies for end-of-life management (EoL management). While landfilling and complete incineration place an additional burden on the environment, recycling can significantly improve a product’s carbon footprint.
The greatest environmental benefit is achieved through recycling following disassembly into individual components. The aim is to recover recyclable materials in as pure a form as possible and to remove harmful substances. After disassembly, individual components—such as glass and aluminum—can be separated and reused, while silicon requires thermal processing. At more than 500 °C it detaches from the laminate. Subsequent chemical cleaning removes residues of silver, copper, soldering tin, and plastics, allowing the recovered silicon to serve as a basis for new silicon crystals and to be used in PV modules. Around three kilograms of silicon and several grams of silver and copper can be recovered from an average solar module. The recycling rate for PV modules is up to 95% of the module’s weight.
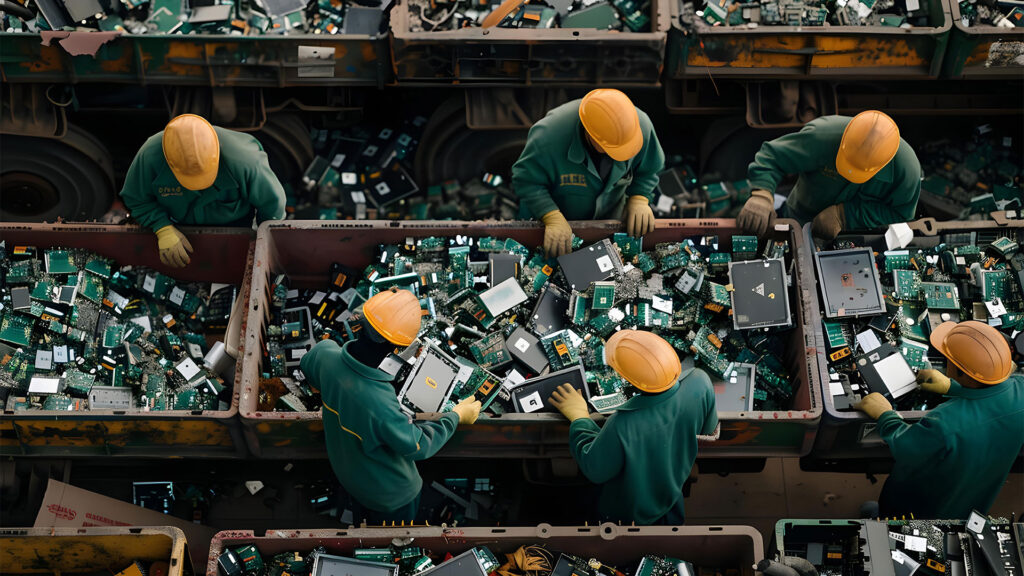
Inverters that have reached the end of their service life can also be recycled very effectively. Recycling is required by law in some countries. Austria’s “Waste Electrical and Electronic Equipment Ordinance” mandates a material recovery rate of at least 85% for inverters, PV modules, and battery storage. The aluminum used in heat sinks and housings, the copper contained in coils and wires, and the small amounts of precious metals that are essential for circuit boards are suitable for recycling. Plastics, on the other hand, are only partially recyclable. After disposal, they are usually incinerated to generate energy.
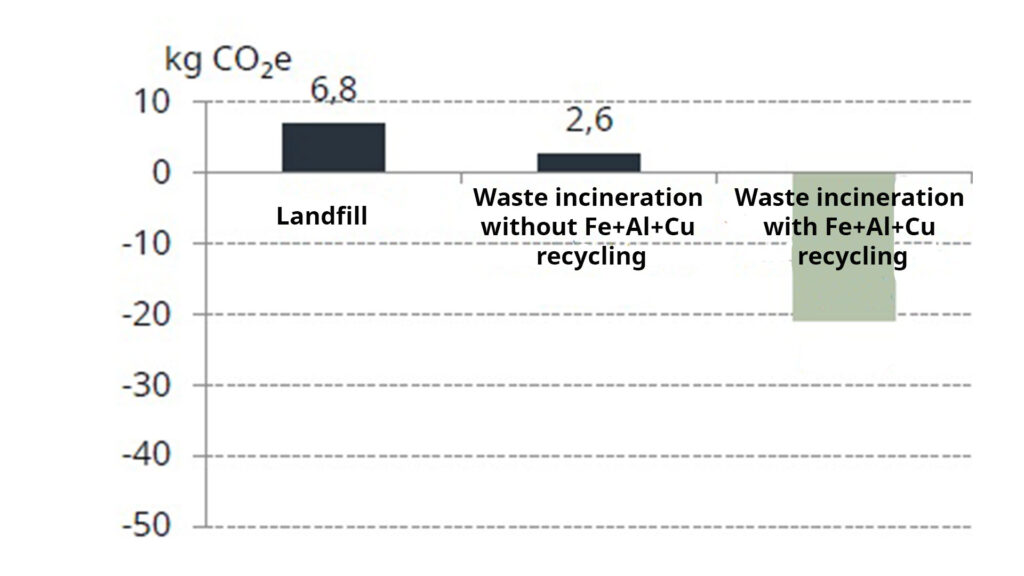
Overall, the disposal of solar panel components accounts for between 2 and 5% of their total greenhouse gas emissions. At the same time, recycling materials results in significant cost savings compared to extracting new ones, thereby enabling the energy-efficient production of new plant components. With efficient end-of-life management, products can even achieve a CO2 credit.
The Fronius Symo GEN24 10.0 Plus generates a CO2 credit of 20 kg through metal recycling and subsequent waste incineration. Landfill disposal and pure waste incineration, on the other hand, would generate 6.8 and 2.6 kg CO2 equivalent respectively (see chart).
How much CO2 do solar panels actually save? A sample calculation
That’s all well and good, however, it does not answer the question of how much CO2 photovoltaic systems save compared to grid electricity. For our example, we will examine two fictional solar panel systems over their total life cycle of 30 years. The first is located in Vienna, the second in Frankfurt. Both systems have the same number of modules, with a total output of 10 kWp and one Fronius GEN24 10.0 Plus inverter. In our example, we assume that the inverter will be replaced after 20 years. This means that we take into account the environmental impact of 1.5 inverters in our calculation. The two PV systems must each be compared with the typical national electricity mix.
The cost-benefit ratio speaks for itself: the carbon footprint of the solar panel system in Vienna is around 10.8 tons, while that of the system in Frankfurt is slightly higher due to longer transport routes and the country-specific, higher-emission electricity mix.
Photovoltaic systems can quickly make up for this environmental impact because each kilowatt hour of electricity produced ‘costs’ only 28.7 or 30.7 g of CO2 equivalent over a period of 30 years. That is significantly lower than the 344 g of CO2 equivalent that one kilowatt hour of electricity generates on average in the German electricity mix. Specifically, the PV system in Germany saves as much CO2 within 1.7 years as its production emitted. We refer to this value—1.7 years—as the ‘CO2 payback time’, as you can see in the table. This term refers to the amount of time it takes for a PV system to offset its carbon footprint. Although it takes nearly a year longer in Austria, solar power still pays for itself fairly quickly from an environmental perspective.
Over its three-decade service life, the system in Austria can generate a net benefit of more than 115 tons of CO2 equivalent, while the system in Germany will generate significantly more, with a total of 177.9 tons. That is 11.8 or 17.2 times as much as the cost of manufacturing and installing the system.
Why is there such a significant difference? At first glance, this may be confusing, but is actually easily explained. The German electricity mix differs significantly from the Austrian mix. While Austria relies primarily on hydroelectric and wind power for its energy supply, Germany incorporates much more lignite, hard coal, and natural gas into its energy mix—energy sources that have a larger carbon footprint. To illustrate this: 75 to 80% of the electricity that flows out of Austrian sockets comes from renewable sources; in Germany the figure is currently around 57%.
| AT | DE | ||
| GWP emissions kg CO2 eq (30 years, complete PV, 1.5 inverters) | kg CO2e | 10 755.95 | 10 989.65 |
| Total CO2 benefit (kg CO2 eq, 30 years) | kg CO2e | – 126 399.09 | – 188 940.91 |
| Net benefit | kg CO2e | – 115 643.14 | – 177 951.26 |
| Cost-benefit ratio | 11.8 | 17.2 | |
| CO2 payback time | Year | 2.6 | 1.7 |
Summary: Solar energy is eco-friendly
Raw material extraction, manufacturing of individual components, transportation, assembly and maintenance work, waste management, and recycling: all of these factors have a significant impact on the carbon footprint of solar energy.
It is true that solar technology relies on certain rare precious metals, aluminum, glass, and silicon, the extraction of which requires a great deal of energy. Many of these products come from countries that meet most of their energy needs through coal-fired power plants, which has a negative impact on their environmental footprint. When conducting a life cycle assessment of PV systems, the supply routes for raw materials and products to their final destination must not be overlooked, nor should waste management once the components have reached the end of their useful life.
Nevertheless, our two example systems in Austria and Germany can generate an enormous CO2 benefit. Depending on the electricity mix in each country, they save 11.8 or 17.2 times as much CO2 equivalent as the greenhouse gas emissions generated by their production. Of course, every PV system is unique due to its location and components and will generate different amounts of solar energy over the course of its operation.
In summary, yes, from an environmental point of view, solar energy pays off.
Note: In this article, we drew on data from the International Energy Agency (IEA) and the Fraunhofer Institute for Solar Energy Systems (ISE). The calculations were based on the average values for various module types in terms of their efficiency and environmental footprint. After all, there are various types of modules of varying quality, which are manufactured primarily—though not exclusively—in Asia. As for the inverter, we relied on our own in-house information and opted for our Fronius Symo GEN24 10.0 Plus. Since Fronius avoids air freight and manufactures its products using electricity generated by its own rooftop solar panels as well as green energy, we are able to reduce the carbon footprint of our inverters. This means that the specifications of your existing or planned PV system may differ from those in this blog post if a product from a different inverter manufacturer is installed.
Would you like to learn more about the environmental benefits of the Fronius Symo GEN24 10.0 Plus? You’ll find many more interesting facts and figures in our life cycle analysis.